
- WordPress
How to Speed Up Your WordPress Site (Core Web Vitals for Beginners)
By Ehasanul Haque
Posted on September 19, 2026

Ever run your site through PageSpeed Insights and stared at the result?
Most beginners get a score somewhere in the orange, a wall of red and yellow audit lines underneath it, and zero idea what any of it means.
LCP, CLS, INP, TTFB. It reads like a password nobody gave you.
This guide is WordPress speed optimization for beginners, in plain English. Here’s the reassuring part: your site’s speed comes down to a small number of real factors, and the report is just naming them.
Once you know what each term means, the whole page stops being noise and starts being your checklist.
You’ll get the actual terms, what makes each one bad, and what every section of your PageSpeed report is telling you to fix. No developer needed.
Let’s dive in.
Key Takeaways
- Core Web Vitals are three specific metrics (LCP, INP, CLS) that measure loading speed, responsiveness, and visual stability. Google uses real visitor data for them, not just a lab test.
- A slow WordPress site almost always traces back to five things: hosting, unoptimized images, too many plugins, no caching, and heavy third-party scripts.
- The rest of a PageSpeed report is diagnostics, specific reasons your score is what it is, grouped by network, code, images, and caching.
- TLS and HTTPS aren’t Core Web Vitals, but the TLS handshake is part of how long your server takes to respond, which does affect your LCP.
What Actually Slows Down a Beginner’s WordPress Site
Before the vocabulary lesson, the plain-English version.
Most slow WordPress sites are slow for one of these reasons, usually more than one at once:
- Cheap or overloaded hosting. Shared hosting packs hundreds of sites onto one server. When a neighbor’s site spikes in traffic, yours can slow down too, and there’s nothing in your dashboard that fixes that.
- Images nobody resized. A photo straight off a phone can be 4 or 5 megabytes. Dropped into a post at 600 pixels wide, the browser still downloads the full file and shrinks it visually. That single image can outweigh the rest of the page combined.
- Plugin sprawl. Every plugin can add its own CSS file, its own JavaScript file, sometimes both, loaded on every page whether that plugin is doing anything on that page or not.
- No caching at all. Without caching, WordPress rebuilds the entire page from the database on every single visit. A cache saves a finished copy and serves that instead. It’s the single biggest lever most beginners haven’t pulled.
- Third-party scripts. Analytics tags, chat widgets, ad scripts, embedded videos. Each one is a request to someone else’s server, on someone else’s timeline, and your page waits on it.
None of these need a developer. They need a caching setup (covered in Top 6 WordPress Caching & Speed Plugins) and about twenty minutes of attention to the list above.
That’s genuinely it.
Core Web Vitals, Actually Explained
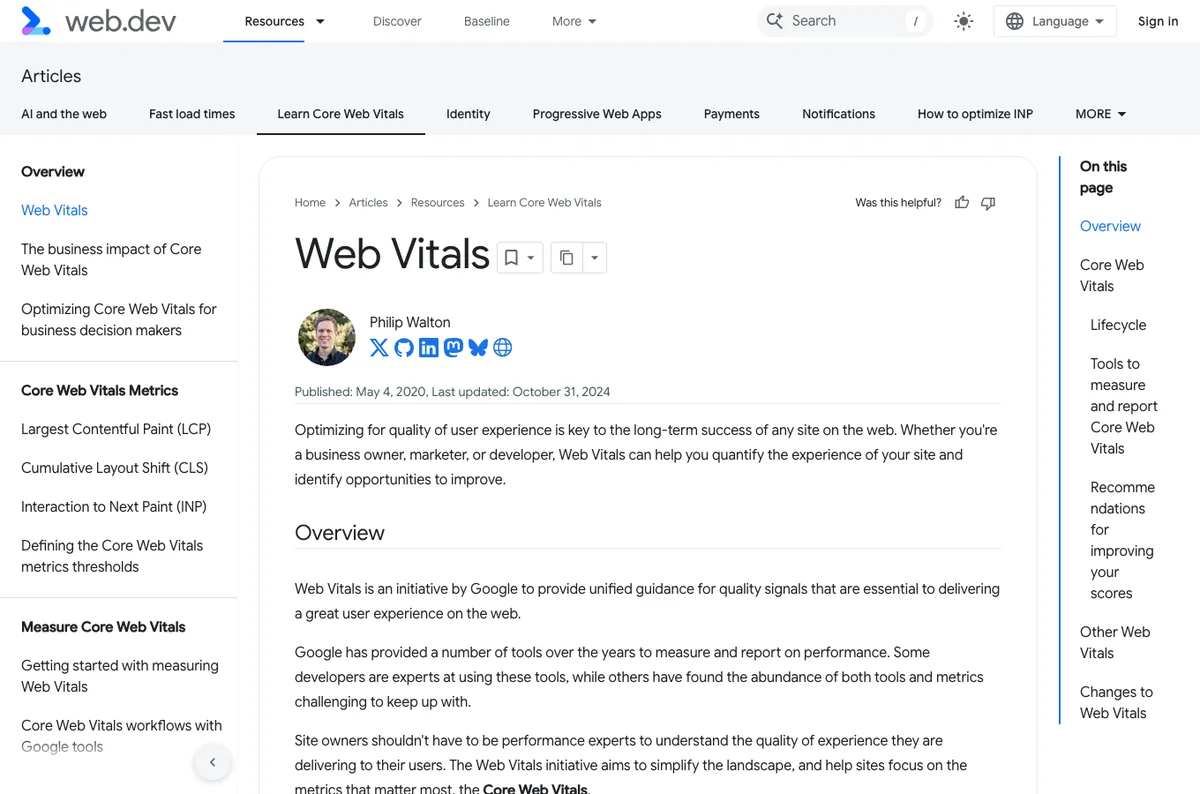
Core Web Vitals are three metrics Google uses to measure real-world user experience: how fast the page loads, how quickly it responds to a click or tap, and how much it visually jumps around while loading.
They’re not a lab guess. Google pulls this from the Chrome User Experience Report (CrUX), which is anonymized data from actual Chrome visitors to your site.
In other words, it’s how your real visitors experience your pages.
LCP: Largest Contentful Paint
LCP measures how long it takes the biggest visible element on the screen (usually a hero image, a heading, or a large block of text) to fully render.
It’s your visitor’s answer to “did anything actually show up yet?”
What makes LCP bad:
- A large, unoptimized hero image
- A slow server response, so nothing can start rendering until the server replies
- CSS or fonts that block rendering while they load
- The browser not discovering the LCP image early enough, because it’s buried in JavaScript instead of a plain
<img>tag
| Rating | LCP |
|---|---|
| Good | 2.5 seconds or less |
| Needs Improvement | 2.5 to 4 seconds |
| Poor | over 4 seconds |
INP: Interaction to Next Paint
INP measures how long it takes the page to visibly respond after someone clicks, taps, or types.
This one replaced an older metric called First Input Delay (FID) in March 2024. FID only measured the first interaction. INP watches every interaction for the whole visit and reports the slowest one that matters.
What makes INP bad? JavaScript that locks up the browser’s main thread. Heavy scripts, too many event listeners doing too much work, third-party widgets running code on every click.
The button looks clickable. The click just doesn’t do anything for half a second.
| Rating | INP |
|---|---|
| Good | 200 milliseconds or less |
| Needs Improvement | 200 to 500 milliseconds |
| Poor | over 500 milliseconds |
CLS: Cumulative Layout Shift
CLS measures how much visible content shifts position while the page is loading.
You know the feeling. You go to tap a button, an ad loads in above it, and you tap the wrong thing instead.
What makes CLS bad:
- Images or embeds with no width and height set, so the browser doesn’t reserve space for them
- Web fonts swapping in late and reflowing the text around them
- Ads, popups, or cookie banners injected after the page already rendered
- Animations that trigger a layout recalculation instead of running on the GPU
| Rating | CLS |
|---|---|
| Good | 0.1 or less |
| Needs Improvement | 0.1 to 0.25 |
| Poor | over 0.25 |
The supporting cast: FCP, TTFB, TBT, Speed Index, TTI
These aren’t official Core Web Vitals, but PageSpeed reports them because they help explain why your Vitals look the way they do.
- FCP (First Contentful Paint): the moment anything shows up on screen, even just background color or a single line of text. Earlier than LCP, and a decent early signal.
- TTFB (Time to First Byte): how long the browser waits for the server to send back the very first byte of the page. This is pure server and network time, before the browser has even started rendering anything, and it includes the TLS handshake (more on that below).
- TBT (Total Blocking Time): adds up every stretch of time the main thread was too busy to respond to input. It’s a lab stand-in for INP, since INP itself needs real visitor data that a one-off test doesn’t have.
- Speed Index: how quickly the page’s content visually fills in, expressed as a single number. Lower is faster.
- TTI (Time to Interactive): the point where the page looks ready and actually responds normally to input.
One thing worth saying plainly: a lot of beginners open PageSpeed Insights expecting a real-user score and instead see “no data available.”
That’s normal, not broken. Google only shows field data (the CrUX numbers) once a site has enough Chrome traffic over the past 28 days. A newer or lower-traffic site gets lab data only, which is a simulated run. Useful, but not the same thing as what your actual visitors experience.
What Every Line of Your PageSpeed Report Means
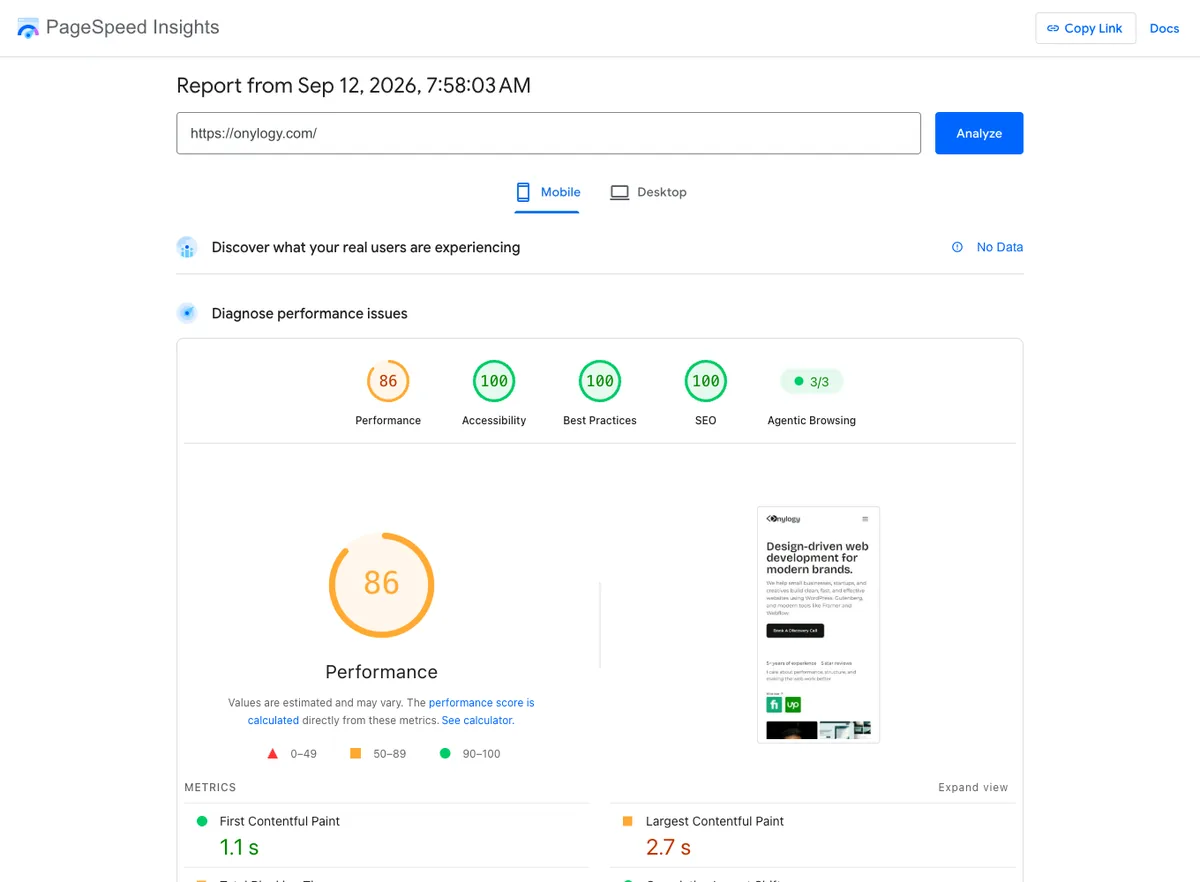
Scroll past the big colored gauge and you hit a long list of audits. Don’t panic. Here’s what each group is actually telling you.
For reference, onylogy.com scored 86 on mobile with a 2.7 second LCP when we ran it in September 2026. That’s the kind of orange most beginners see, and it’s fixable.
Loading and network
- Initial server response time / TTFB: how fast your server itself answers. Slow here usually means weak hosting, no server-side caching, or a bloated database.
- Avoid multiple page redirects: every redirect (like
http://bouncing tohttps://www) adds a full network round trip before the real page even starts loading. - Render-blocking requests: CSS or JavaScript the browser must download and process before it can paint anything, even content that doesn’t need that file.
- Network dependency tree / critical request chain: shows which files are stacked in a queue behind each other. A long chain means the browser can’t fetch everything at once; it has to wait its turn.
- Network round trip time (RTT): pure distance and latency between the visitor and your server. Partly fixed by using a CDN closer to your visitors.
JavaScript and CSS
- Reduce unused CSS / unused JavaScript: code your theme or plugins loaded on this page that this page never actually uses. Common with page builders that load their full toolkit on every single page.
- Minify CSS / minify JavaScript: stripping whitespace, comments, and formatting characters that exist for human readability, not for the browser.
- Legacy JavaScript: modern browsers already understand modern JavaScript. Shipping old-browser-compatible fallback code to everyone is dead weight for almost all your visitors.
- Duplicated JavaScript: the same library loaded twice by two different plugins that don’t know about each other.
- Avoid long main-thread tasks / forced reflow: JavaScript that hogs the browser’s single processing thread for too long in one go, which is exactly what drags your INP down.
Images and fonts
- Improve image delivery: images served larger, heavier, or in an older format (JPEG/PNG) than they need to be, instead of modern formats like WebP or AVIF.
- Properly size images: serving a 2000px-wide image into a 400px-wide box and letting the browser do the shrinking.
- Image elements have explicit width and height: without these, the browser can’t reserve space before the image loads, which is a direct cause of layout shift.
- Font display: controls what visitors see while a custom web font is still downloading: invisible text, a fallback font, or nothing until it’s ready.
Page weight and structure
- Avoids enormous network payloads: the total download size of the page. Heavier pages take longer on slower connections, full stop.
- Optimize DOM size: how many individual HTML elements are on the page. A bloated page builder layout can quietly generate thousands of nested
<div>s the browser has to track.
Caching
- Use efficient cache lifetimes: whether your server tells the browser “you can reuse this file for a week” or effectively nothing at all, forcing a fresh download on every visit.
Where TLS and HTTPS Fit In
TLS doesn’t show up as a Core Web Vital, and it isn’t the thing making your page visually slow. It sits earlier than that, in the handshake.
TLS (Transport Layer Security) is the encryption protocol behind HTTPS.
Before your browser and the server exchange a single byte of the actual page, they negotiate a secure connection: agreeing on encryption, verifying the site’s certificate, generating session keys.
That negotiation takes a little time, and it happens inside your TTFB number. A slow or misconfigured TLS setup (an old protocol version, a certificate chain that’s too long, a server that’s slow to respond to the handshake itself) adds real milliseconds before the page can even start.
The PageSpeed report checks HTTPS under its Best Practices audits, not Performance: Uses HTTPS (your site is actually served over an encrypted connection) and Redirects HTTP traffic to HTTPS (visitors typing the plain http:// version get bounced to the secure one automatically).
Both matter for trust and for a small SEO signal. Neither one is optional in 2026.
A good host handles this for you with a free certificate. Confirm it rather than assuming.
Here’s a category almost nobody expects to see in a speed tool: PageSpeed Insights now also scores Agentic Browsing, a check for how well an AI agent (something like an automated assistant navigating your site on a user’s behalf) can actually parse and use your page.
It has nothing to do with load time. Worth knowing it exists; not something this guide is going to chase.
Fixing What You Found
Match the report section to the fix, and you’ll clear most of your red lines in an afternoon:
- Slow TTFB / server response → better hosting or server-side caching. See Top 6 Hosting Providers for WordPress.
- Render-blocking CSS/JS, no caching headers, unminified files → a caching plugin. Compared in Top 6 WordPress Caching & Speed Plugins, with a full walkthrough in How to Set Up LiteSpeed Cache if your host supports it.
- Heavy, oversized images → compress before upload, serve WebP, and always set width/height. The image optimization roundup picks the plugin.
- Bloated DOM, plugin sprawl → an honest plugin audit. If you don’t know what a plugin does, that’s usually the sign to deactivate it and see what breaks.
- Third-party scripts (chat widgets, ad tags, embeds) → keep only what earns its place, and load the rest with a “delay until interaction” setting if your caching plugin offers one.
Which Fix Should You Do First?
On shared hosting with a slow TTFB? Start there. No amount of image compression fixes a server that takes two seconds just to say hello.
Server already responds fast? The next biggest win for most WordPress sites is caching. It’s a single setup that touches almost every other metric at once.
Images come third. Not because they matter less, but because they’re the easiest to fix wrong (compressing one hero image while ignoring forty thumbnails further down the page) and easy to fix well once you actually look.
Don’t worry about doing all of it in one sitting. One fix a day gets you there.
Final Thoughts
That’s the vocabulary and the map.
LCP, INP, and CLS aren’t abstract letters. They’re loading, responsiveness, and stability, and each one traces back to something concrete you can point at in your report. The rest of the audit list is just PageSpeed showing its work.
Run your own site through PageSpeed Insights right now and match what you see against the sections above. You’ll probably recognize exactly which two or three things are dragging your score down.
Fix those, and the score follows. Plain and simple.
Over to you: what’s your mobile score today, and which of the five causes is yours? Let me know in the comments.
Frequently Asked Questions
What’s a good PageSpeed score for WordPress?
Anything in the 90s is strong, but the score itself is less important than passing all three Core Web Vitals thresholds (LCP under 2.5s, INP under 200ms, CLS under 0.1). A site can score 100 in the lab and still fail Core Web Vitals in the real world, and vice versa.
Why does my mobile score look so much worse than desktop?
PageSpeed tests mobile with a slower simulated device and a throttled connection, on purpose, because that’s closer to how a real visitor on a mid-range phone actually experiences your site. Desktop numbers are almost always higher.
What replaced FID, and why?
INP (Interaction to Next Paint) replaced First Input Delay in March 2024. FID only measured the very first click; INP measures every interaction for the whole visit and reports the worst one, which is a far more honest picture of responsiveness.
Do I need a caching plugin if my host already has server-level caching?
Often you still benefit from one, since plugin-level caching can handle things server caching doesn’t, like minification and image optimization. Check what your host’s caching actually covers before assuming you’re doubled up.
Does TLS/HTTPS actually affect my speed score?
Not directly as a Core Web Vital, but the TLS handshake happens inside your TTFB, so a slow or misconfigured setup adds real time before anything renders. It’s also checked separately under Best Practices.
Why does PageSpeed say “no data available” for my site?
Google only shows real-user (CrUX) field data once a site has enough recent Chrome traffic. Lower-traffic or newer sites get lab data only, a simulated single test run, which is useful but not the same as real visitor experience.
Should I try to get a perfect 100 score?
Past a certain point, no. Chasing the last few points usually means trading away something else (aggressive lazy-loading that hurts UX, stripping fonts entirely) for marginal gains nobody will notice. Passing the Core Web Vitals thresholds matters far more than the headline number.
You May Also Like
-

Kadence Blocks Default Settings
Just installed Kadence Blocks and wondering which Kadence Blocks settings… -
Kadence Blocks for WordPress
Building your WordPress site with Kadence Blocks? Good choice. It’s… -
Build a Homepage with Kadence Blocks
Ready to build a homepage with Kadence Blocks and not…